
One of the critical benefits of having your logbook online is that it gives you very rich ways to analyze your flying data. Today I'm going to discuss 6 different ways (and refer to two others!) that you can slice and dice your flying to gain insights, answer questions, or demonstrate experience. I'll discuss this in the context of the website, but most of this functionality is also directly available in the iOS or Android apps.
Totals
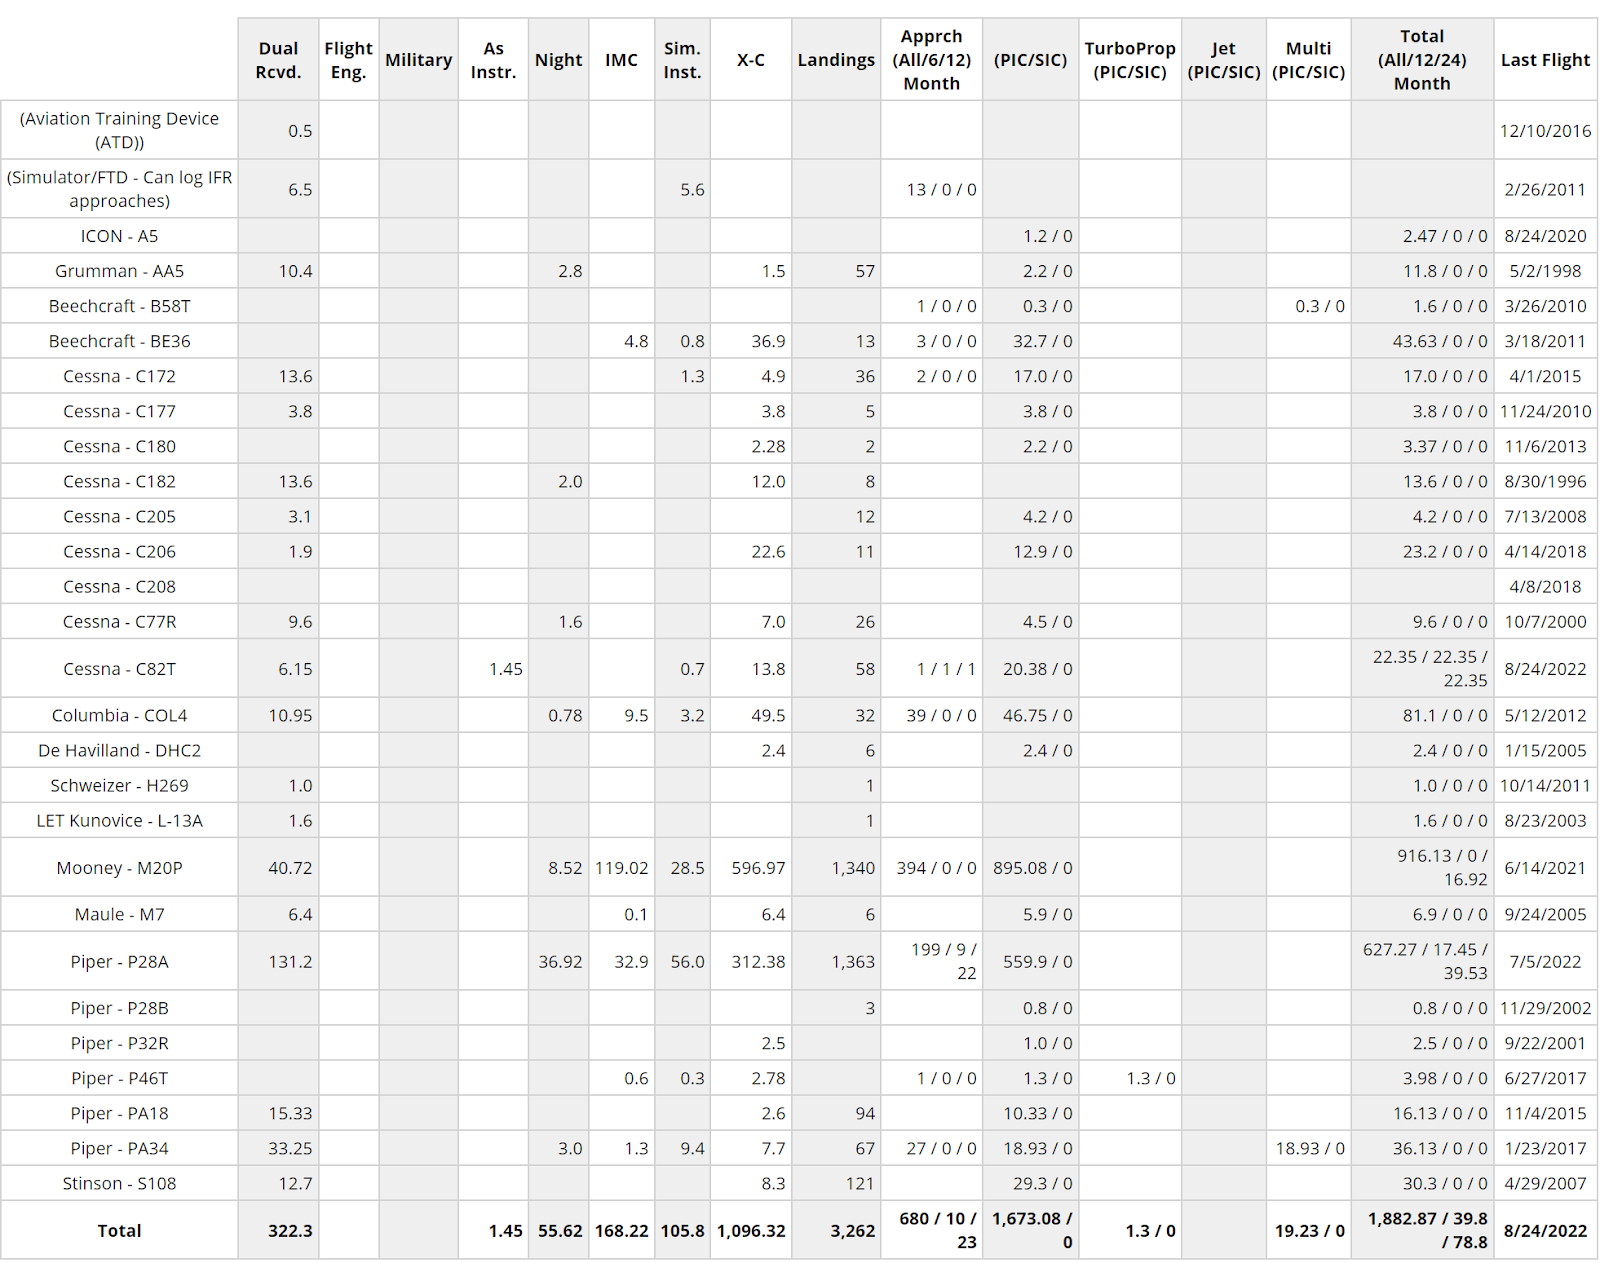
The first and simplest is, of course, totals. By default, Totals shows you, well, umm, everything that can be summed up. Internally, believe it or not, while there's a core set of known things to total, the list is not fully pre-determined; it's largely up to you and what's in your logbook.
Here's my totals as of today:

The first group, by default, shows you your total times broken down by category, class, and (if a type rating is required), type. An example of "type rating" in the US would be a 737, which requires a "B-737" type rating to fly. If I had some 737 time, then you'd see 737 time broken out as a subset of AMEL time.
If you like, you can change this to group by model instead of by category/class (go to Profile->Preferences->Currency/Totals; this will be reflected on iOS or Android apps, but you can only make the change on the website). You can define a "model" for this purpose as either being a very specific model ("C-172 S" is distinct from "C-172 P") or by ICAO code (both a C-172 S and a C-172 P are "C172"). This creates a new section with your totals by model. In my case, it looks like this when I use the more specific model definition:

"Hours" for purposes of total time and for the category/class and model times is what you've logged in the "Total Flight Time" field. So if you had a 1 hour session in a sim emulating a Boeing 737, if you logged an hour of total time, that will count as an hour of total time (overall), an hour of AMEL time, and an hour of AMEL (B-737) time. (This is why, in general, you should NOT log sim time in the "Total Flight Time" field. See my previous posts on this topic).
I titled this post "Slicing and dicing" and yes, you can slice/dice your totals. Totals are search sensitive! Notice that most of the totals above are blue, indicating that you can click on them (you can tap on them in the iOS/Android apps). This does a search, and then re-displays the totals but only for the flights that matched the search.
So, for example, if I tap on the AMEL total in one of the links above (or do a search for only flights in MEL airplanes and then click totals) I get this:

Totals are a powerful way to get results for common queries - especially from insurance companies who seem to come up with all sorts of obscure totals that they want to know.
8710/IACRA form
The next three ways to slice/dice your data are over on the Training tab (both website and iOS/Android apps). The first is the 8710/IACRA form. Apologies for folks outside of the US - though this is likely useful to you nevertheless! This report mimics the 8710/IACRA form that pilots must fill out before taking an FAA checkride.
Once again, I'll be the guinea pig and use my data for an example:

This should be pretty self-explanatory and straightforward. The two key things to note are:
- Read the footnotes! I specifically disallow a lot of "combination" values like "night PIC" because I can compute them.
- As with totals, this form is also search-sensitive. So if you, for example, log a lot of Microsoft Flight Sim time (doesn't count towards ratings) or want to segregate, say, your military time from your civilian time, you can do the appropriate search to include only the relevant flights and the form will update.
Rollup By Model
Also on the Training tab, this emulates the common Airline Apps page report and hopefully provides all of the relevant information for applying to many airlines (at least here in the US). Again, my data:
Rollup By Time
The final report on the Training tab provides the same data that general Totals provides, but for multiple common time periods. My sample (truncated):
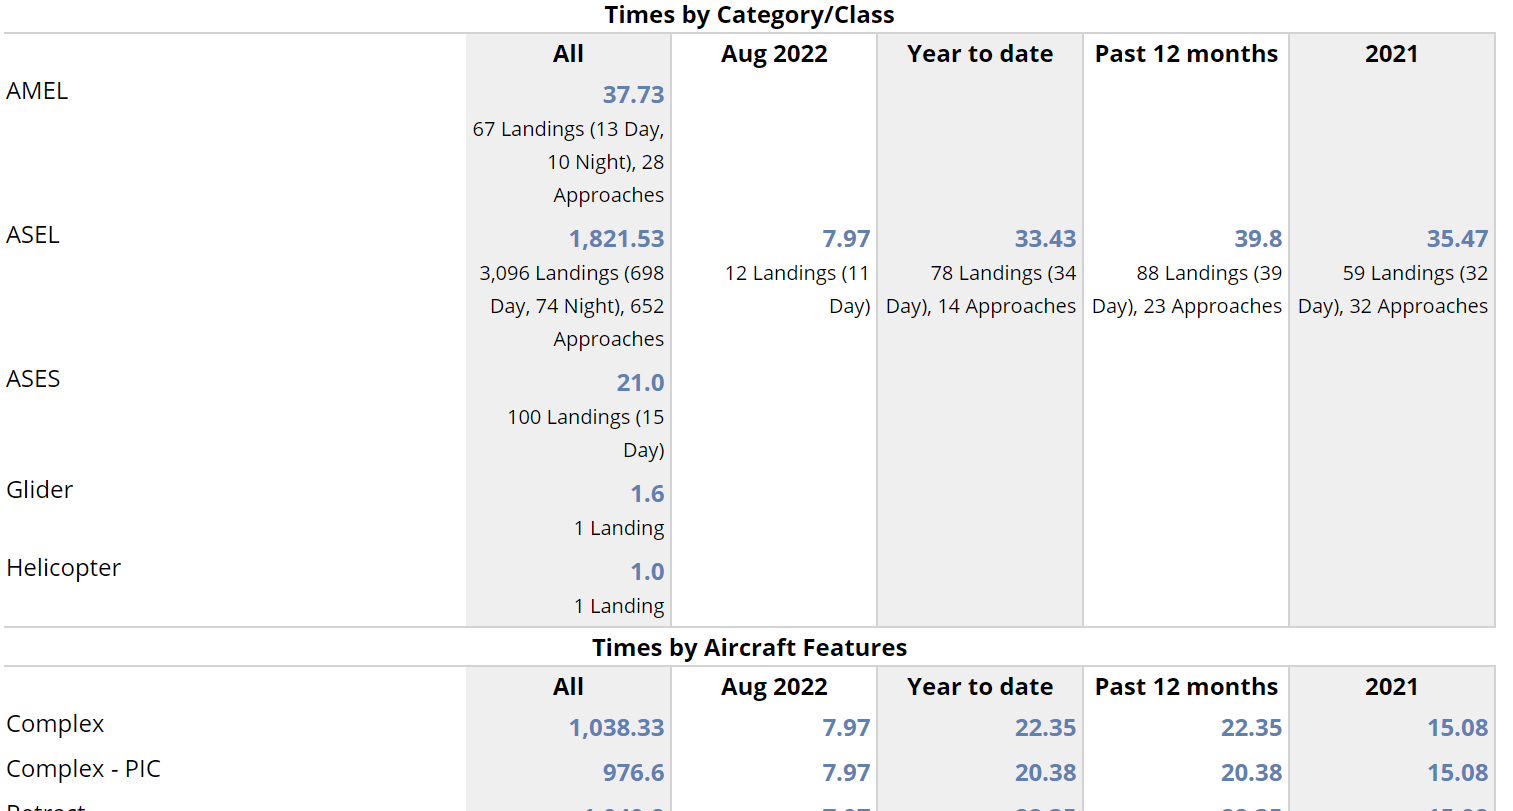
This can be a quick way to view your totals for particular time periods. It is, of course, also search sensitive.
Analysis
Going back to the Logbook tab - and into the first functionality that I will discuss that is web-only - is the Analysis tab. This is where you can view your flying trends graphically.
Here's my default analysis view:

In the example above, note that I am hovering over one of the bars and seeing that (in this example), I flew 84.3 hours in 2017.
The gist of how the analysis tab works is that you can select a value to sum for the Y axis ("Total flight time" in the example above), and a grouping construct ("Year" in the example above) for the X-axis. MyFlightbook looks at all of the flights that match your specified search criteria (you thought maybe it wasn't search sensitive? Silly you...), and puts then each into an appropriate "bucket" for the x-axis based on the grouping. It then sums up the requested value for each of the flights in each bucket. (If this sounds a lot like a pivot table in Excel, that's not accidental...we'll get there below...)
This can be pretty powerful, or merely fun. For example, if I want to know how my flying varies by day of week, I can do that:

Or, I can group by model of aircraft and show the average so I can see which models I've flown more or less than average:

Finally, I'll point out that you can view and download a table of all of your flying filtered (i.e., search sensitivity) and grouped as you've selected, in case you want to do a deeper dive.
Pivot Tables
The final piece of data slicing and dicing you can do with MyFlightbook technically isn't even in MyFlightbook proper; it's in spreadsheet apps like Excel or Google Sheets.
You can download your entire logbook into a CSV file by going to Logbook->Download on the website, and from there loading it into your spreadsheet of choice.
From there, you can apply formulas and create pivot tables to your heart's content, which will allow you to group to multiple levels (e.g., group by category/class, then by model, for example, whereas MyFlightbook's grouping only goes one level deep) or you can customize charts or do filtering searches that MyFlightbook can't do.
Using this functionality is beyond the scope of this blog post - especially since it is dependent on your spreadsheet choice. But it is yet another level of analysis that is available to you.
Other Data Analysis
There are two other data slicing/dicing options that are worth at least mentioning.
One is airports. You can view the airports that you've visited by going to Airports->Visited Airports (on the website; just "Visited" on the mobile apps). Again, this is search sensitive, so you can see which airports you've visited in a given timeframe. You can even compute the distance you've traveled or download your flights into Google Earth.
The other is analysis *within* a flight. All of the discussion above is in the context of your whole logbook - across multiple flights. But if you attach telemetry data to your flight, you can do additional analysis - particularly if it comes from the aircraft itself and has more than just latitude/longitude information. For example, many units will include oil temperatures, cylinder head temperatures, exhaust gas temperatures, fuel levels, true airspeed, and so forth.
MyFlightbook supports a wide variety of telemetry formats, including KML and GPX, but CSV may be the most powerful because it's so extensible and thus can include things like the engine data I just described. You can read more here about the sorts of things that you can include, but the key thing is that when you attach telemetry to a flight, you'll see a paper clip icon next to it:
If you click that icon, you can pick up to two fields to chart against a 3rd field:
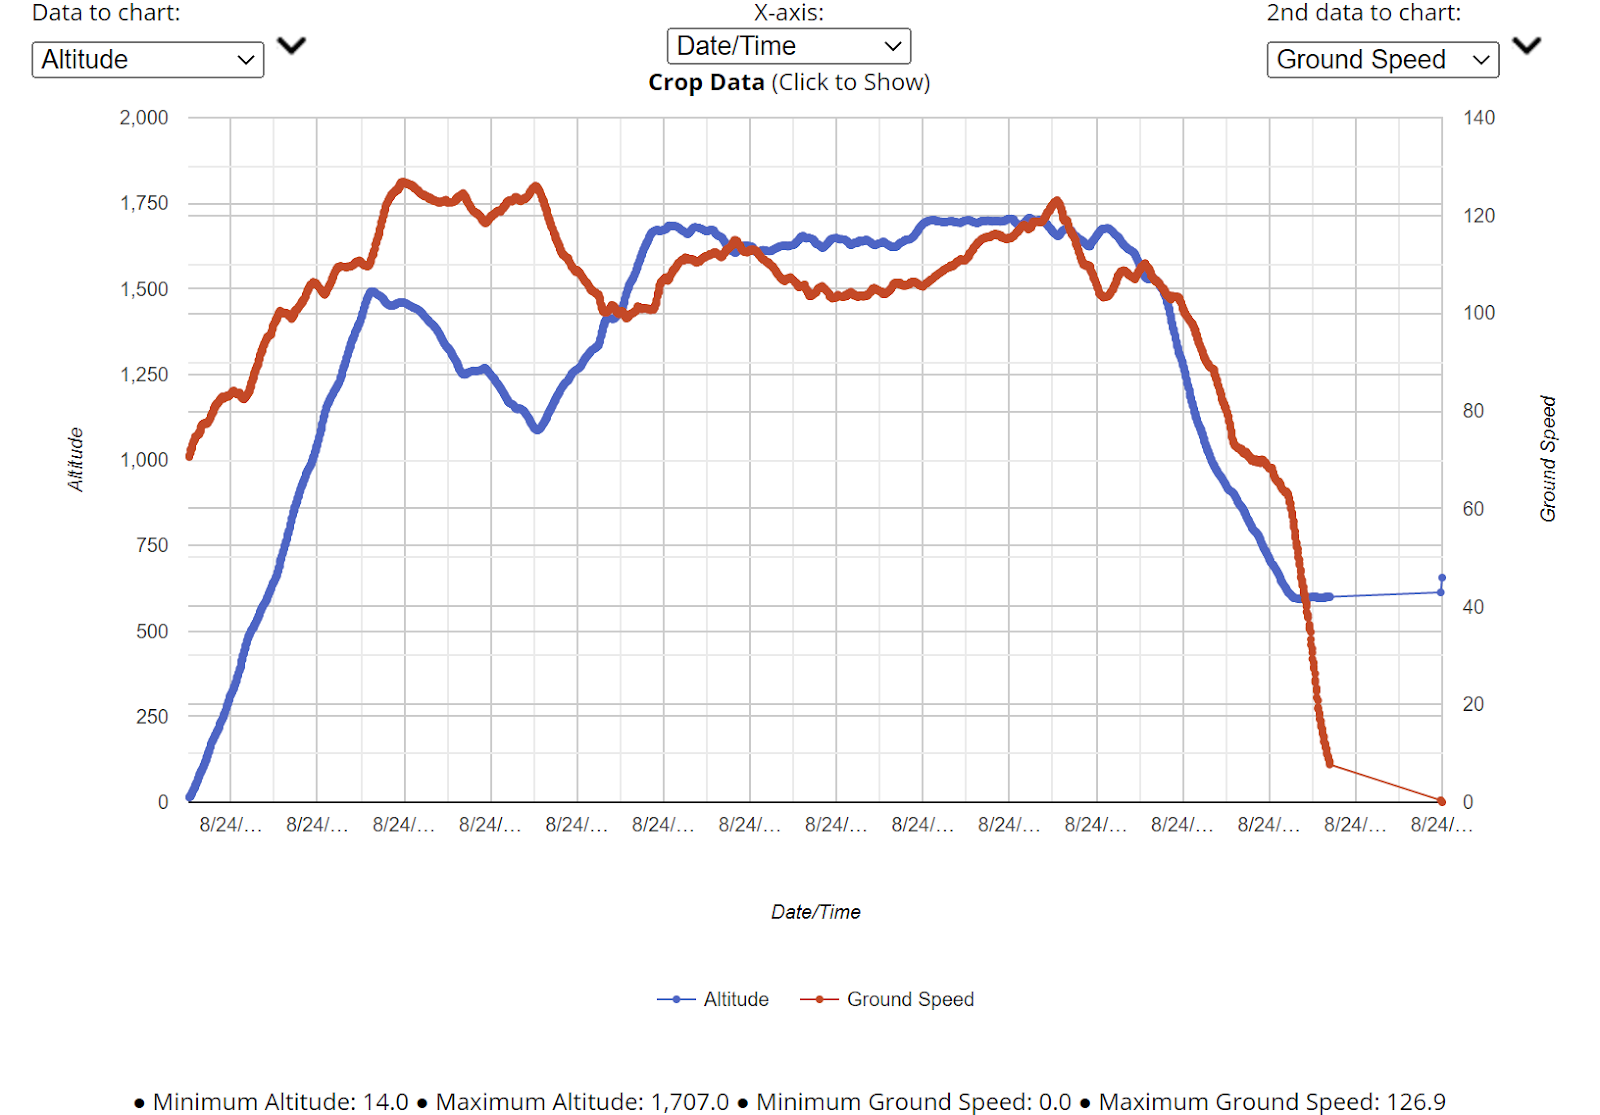
Better still, if the data does include latitude/longitude/time information, you can click on a sample and see on the map beneath the chart where you were when that particular event occurred.
Hopefully somewhere in all of the various tools I've described above, you'll be able to answer any question about your logbook. If not, please let me know and I'll see what I can do!